Performances
Entries accumulation
Overtime, old entries should be removed to ensure the system is not overloaded processing unrelevent data.
See the detailed section about cleanup.
The SCD global lock option
Danger
All DSS instances in a DSS pool must use the same value for this option. Mixing will result in dramatically lower performance.
You can use the /aux/v1/configuration/global_options endpoint to retrive the current value for a specifc DSS instance.
It has been reported in issue #1311 that creating a lot of overlapping operational intents may increase the datastore load in a way that creates timeouts.
By default, the code will try to lock on required subscriptions when working on operational intents, and having too many of them may lead to issues.
A solution to that is to switch to a global lock, that is just globally locking operational intents operations, regardless of subscriptions.
This will result in lower general throughput for operational intents that don't overlap, as only one of them can be processed at a time, but better performance in the issue's case as lock acquisition is simpler.
You should enable this option depending on your DSS usage/use case and what you want to maximize: * If you have non-overlapping traffic and maximum global throughput, don't enable this flag * If you have overlapping traffic and don't need high global throughput, enable this flag
The following graphs show example throughput without (on the left) and with the flag (on the right). This has been run on a local machine; on a real deployment you can expect lower performance (due to various latency), but similar relative numbers.
All graphs have been generated with the loadtest present in the monitoring repository using SCD.py.
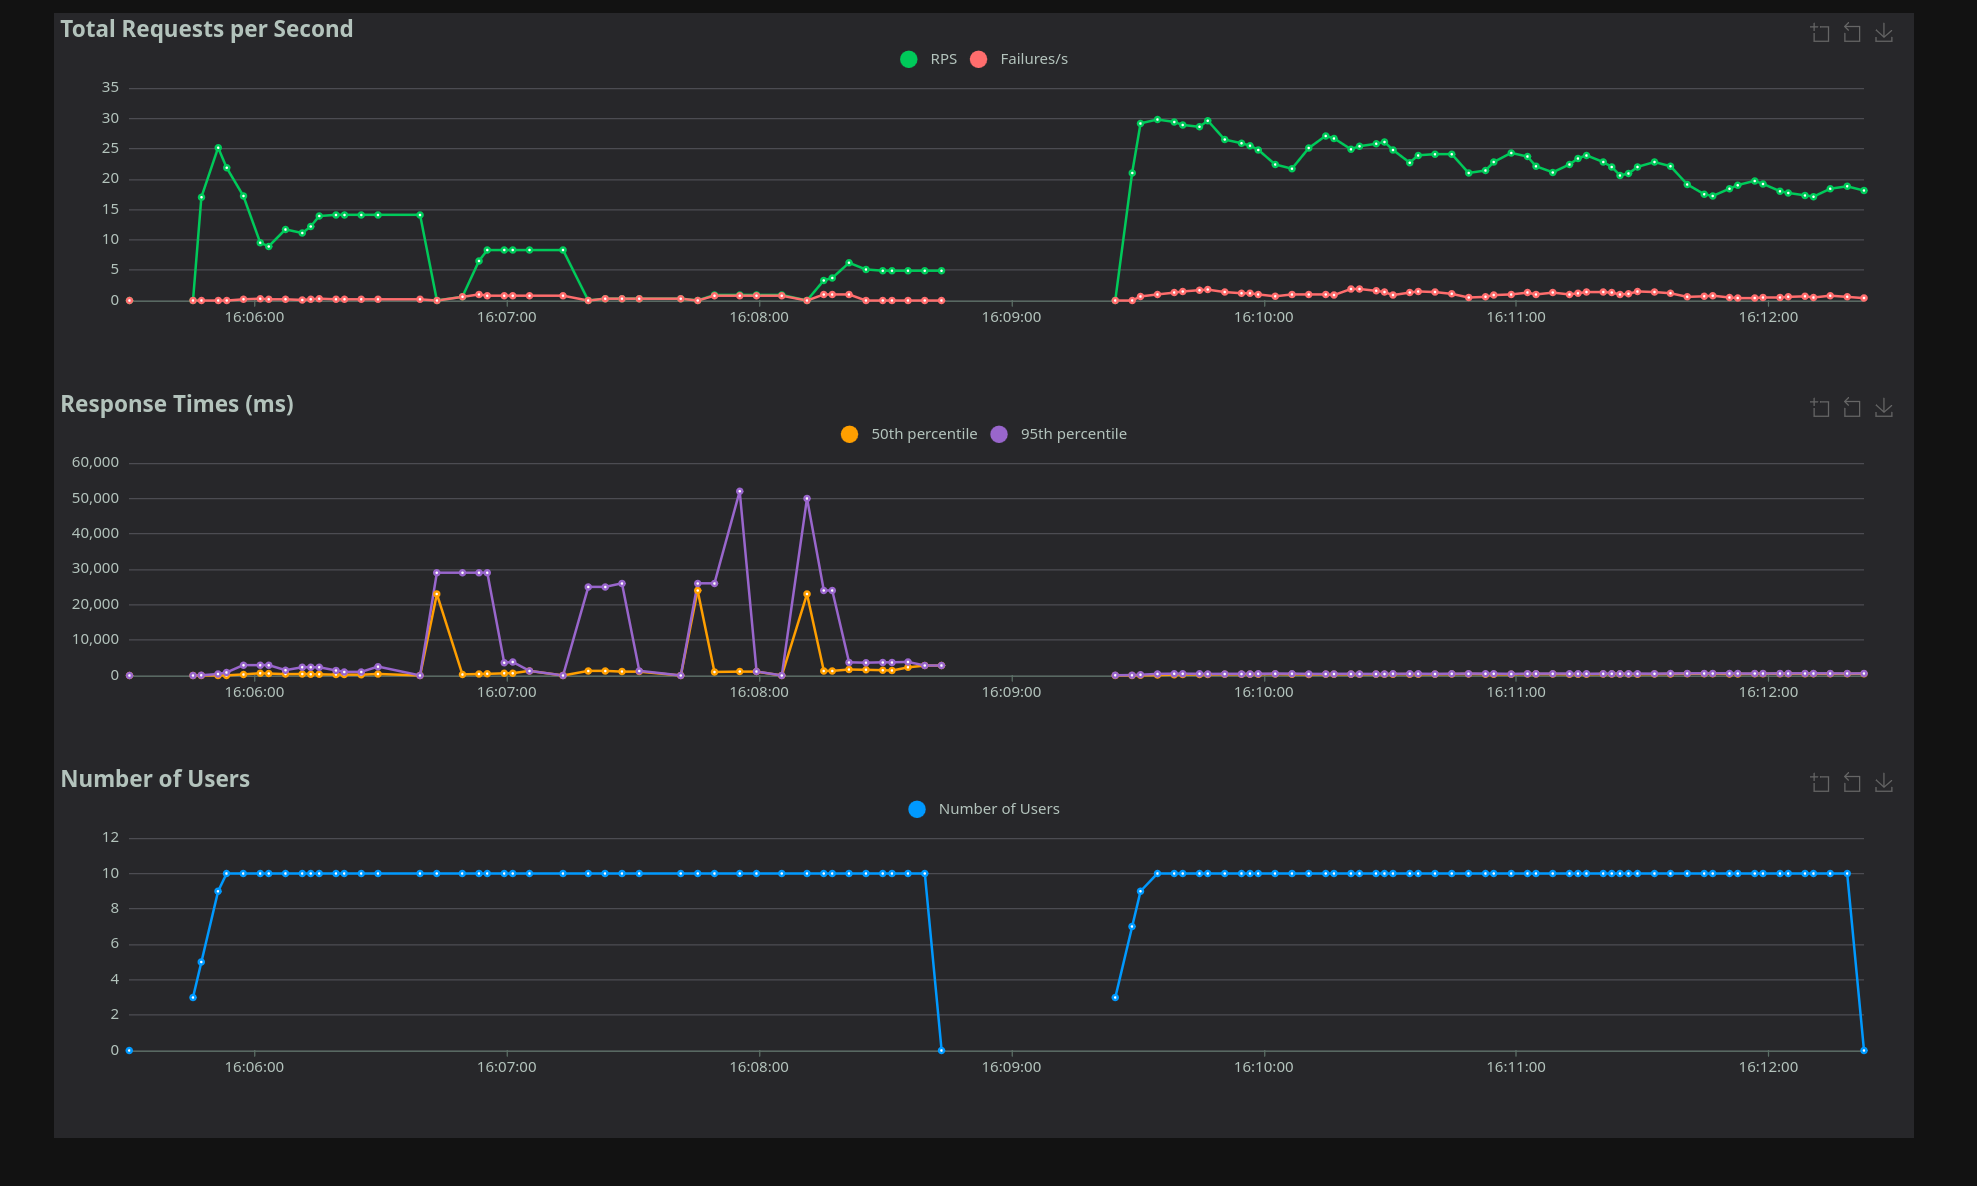 Overlapping requests. Notice the huge spikes on the left, as the datastore struggles to acquire locks.
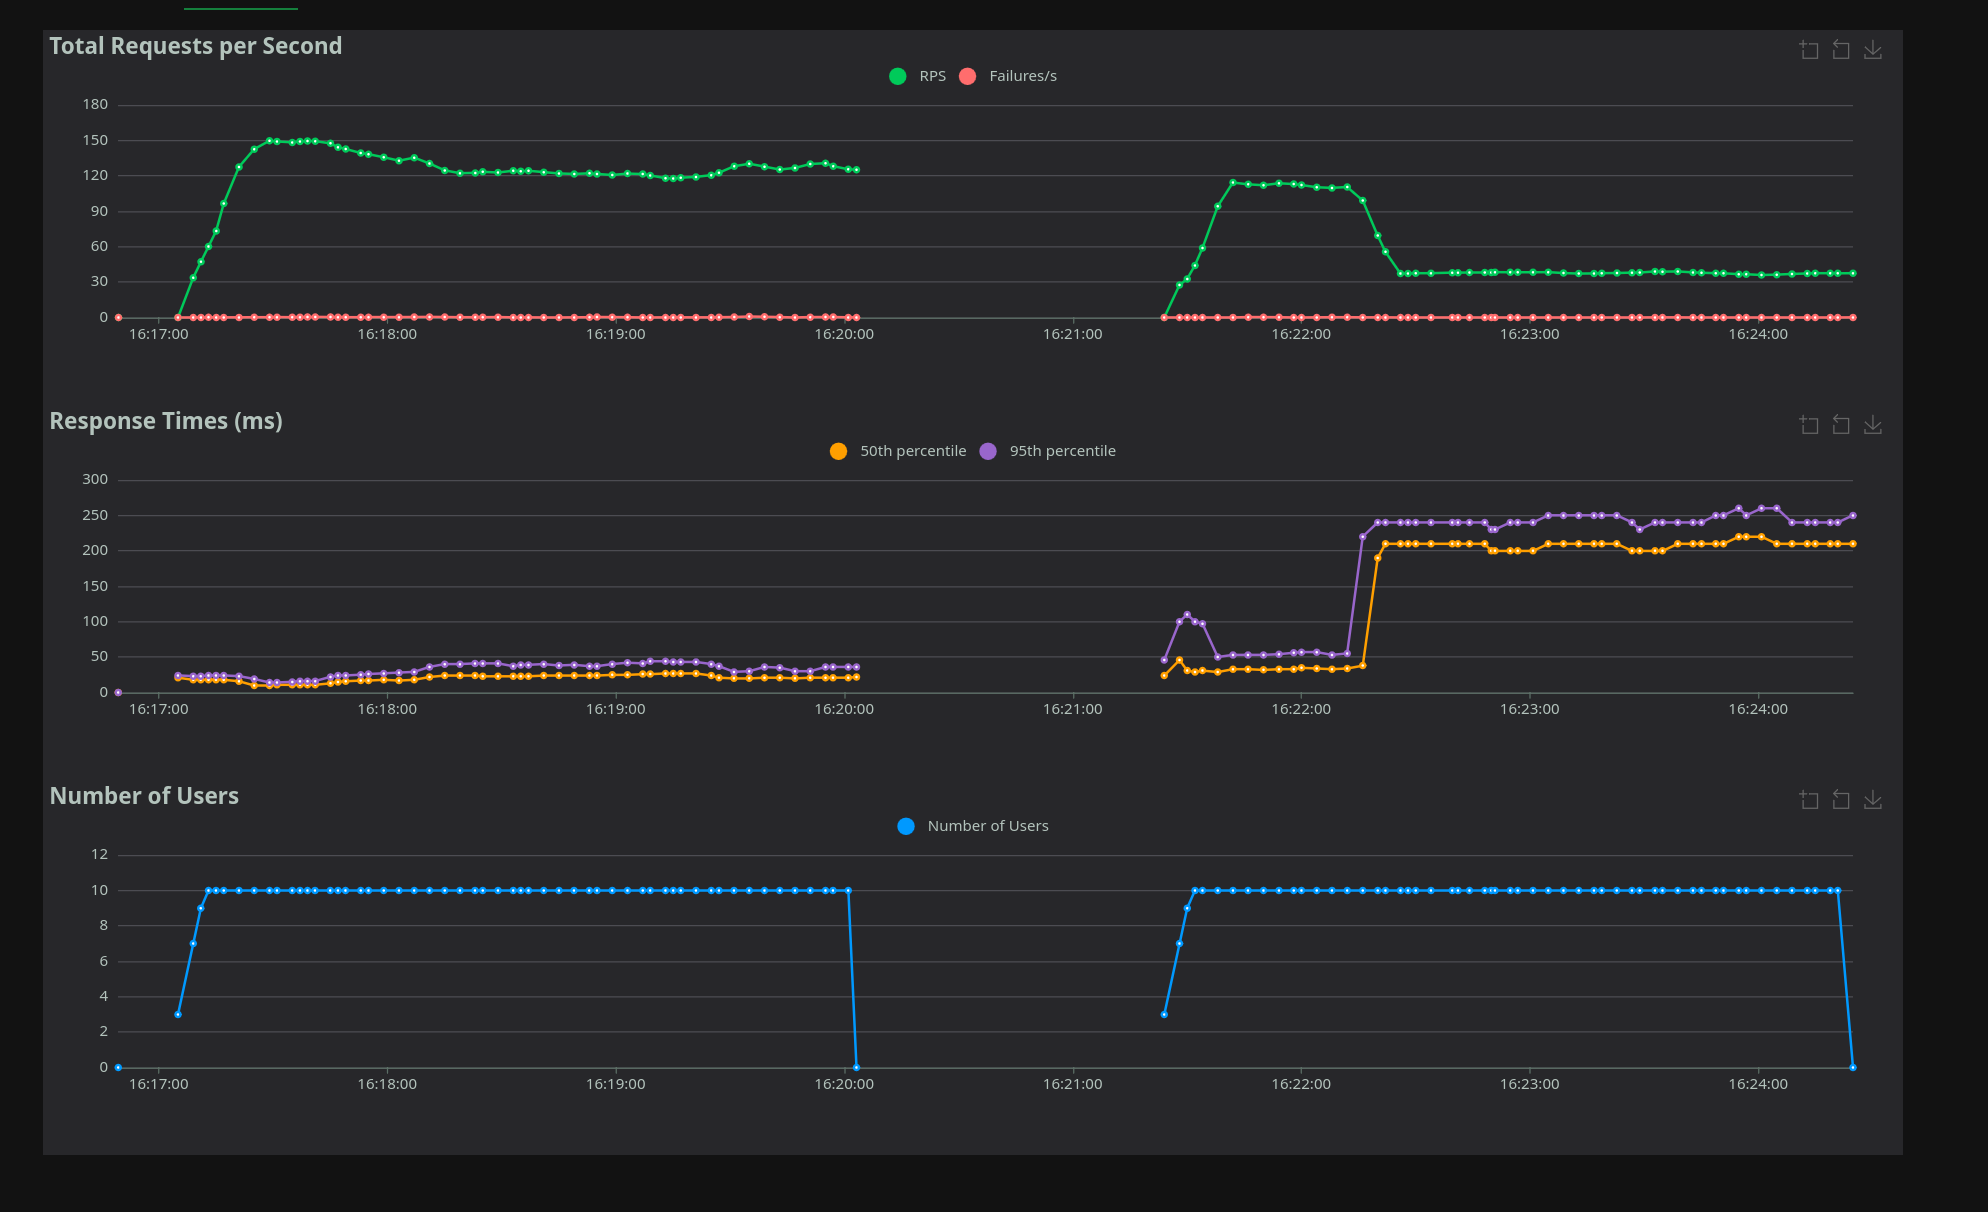 Non-overlapping requests. Notice the reduction of performance on the right, with a single lock.
The time-based notification index option
Danger
All DSS instances in a DSS pool must use the same value for this option. Mixing them will result in undetermined behavior.
You can use the /aux/v1/configuration/global_options endpoint to retrive the current value for a specifc DSS instance.
Following the rationale described in issue #1541, this flag use a time-based system for notification indexes in SCD and RID. Please check the details in the linked issue above and ensure you understand the consequences of enabling this flag, including the specific requirements you want or need to comply with.
SCD lock diagnostics logs
To help diagnose latency spikes (for example as discussed in #1311), the SCD subscription lock path emits targeted warning logs when a lock query looks expensive.
The warning is emitted when lock query duration is greater than or equal to 4s.
The log message is Expensive SCD lock detected and includes:
* global_lock: Whether global lock mode is enabled for this query
* duration: Time spent executing the lock query
* cell_count: Number of S2 cells in the request
* explicit_subscription_id_count: Number of explicitly provided subscription IDs
Failed lock queries also emit warnings with timing and context:
* SCD global lock query failed
* SCD subscription lock query failed
These diagnostics are intended to keep normal logs low-noise while surfacing lock contention or unexpectedly large lock scopes.