Monitoring
Prerequisites
Some of these tools are required to interact with monitoring services.
Grafana / Prometheus stack
When enabled, an instance of Grafana and Prometheus are deployed along with the core DSS services; this combination allows you to view (Grafana) metrics (collected by Prometheus).
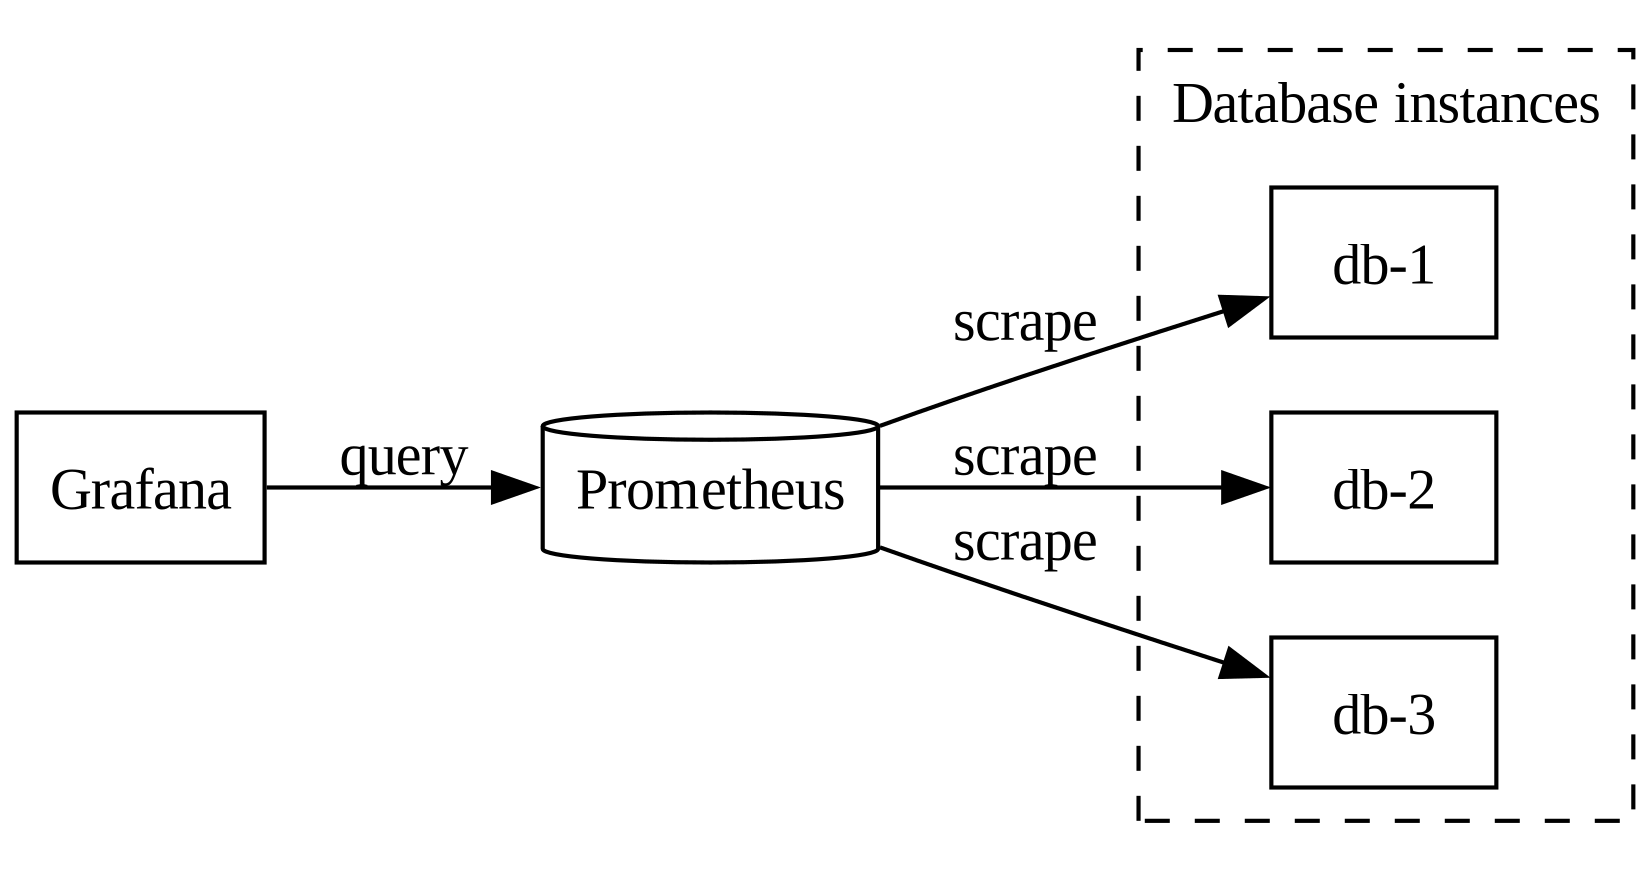
This can be enabled via:
- The
enable_monitoringoption in terraform - The
monitoring.enabledoption in helm - By using tanka, which always enables it
By default, DSS metrics are not enabled; see below, OpenTelemetry section, to activate them.
Grafana access
To access the Grafana interface, first ensure that the appropriate
cluster context is selected (kubectl config current-context). Then, run the
following command:
While that command is running, open a browser and navigate to http://localhost:3000.
The default username is admin with a default password of admin if using tanka, or a random value in a kubernetes secret named <release>-grafana if using helm charts.
Example to retrieve the secret in a default 'dss' release:
Click the magnifying glass on the left side to select a dashboard to view.
Prometheus access
Prometheus access is protected by a client certificate. If you need to access the web interface, you will need to import a valid client certificate in your browser.
Info
For day to day usage, you don't need to access Prometheus, use Grafana instead. This is only useful for debugging.
To build a pkcs12 file from a valid client certificate (use a random password):
Then import this file as client certificate in your browser.
- Firefox: Preferences > Privacy & Security > View Certificates > Your Certificates > Import
- Chrome: Privacy and security > Security > Manage Certificates > Import
Next time you access the interface, select the certificate you just imported.
Prometheus Federation (Multi Cluster Monitoring)
Prometheus Federation enables you to easily monitor multiple clusters of the DSS that you operate, unifying all the metrics into a single Prometheus instance where you can build Grafana Dashboards. Enabling Prometheus Federation is optional.
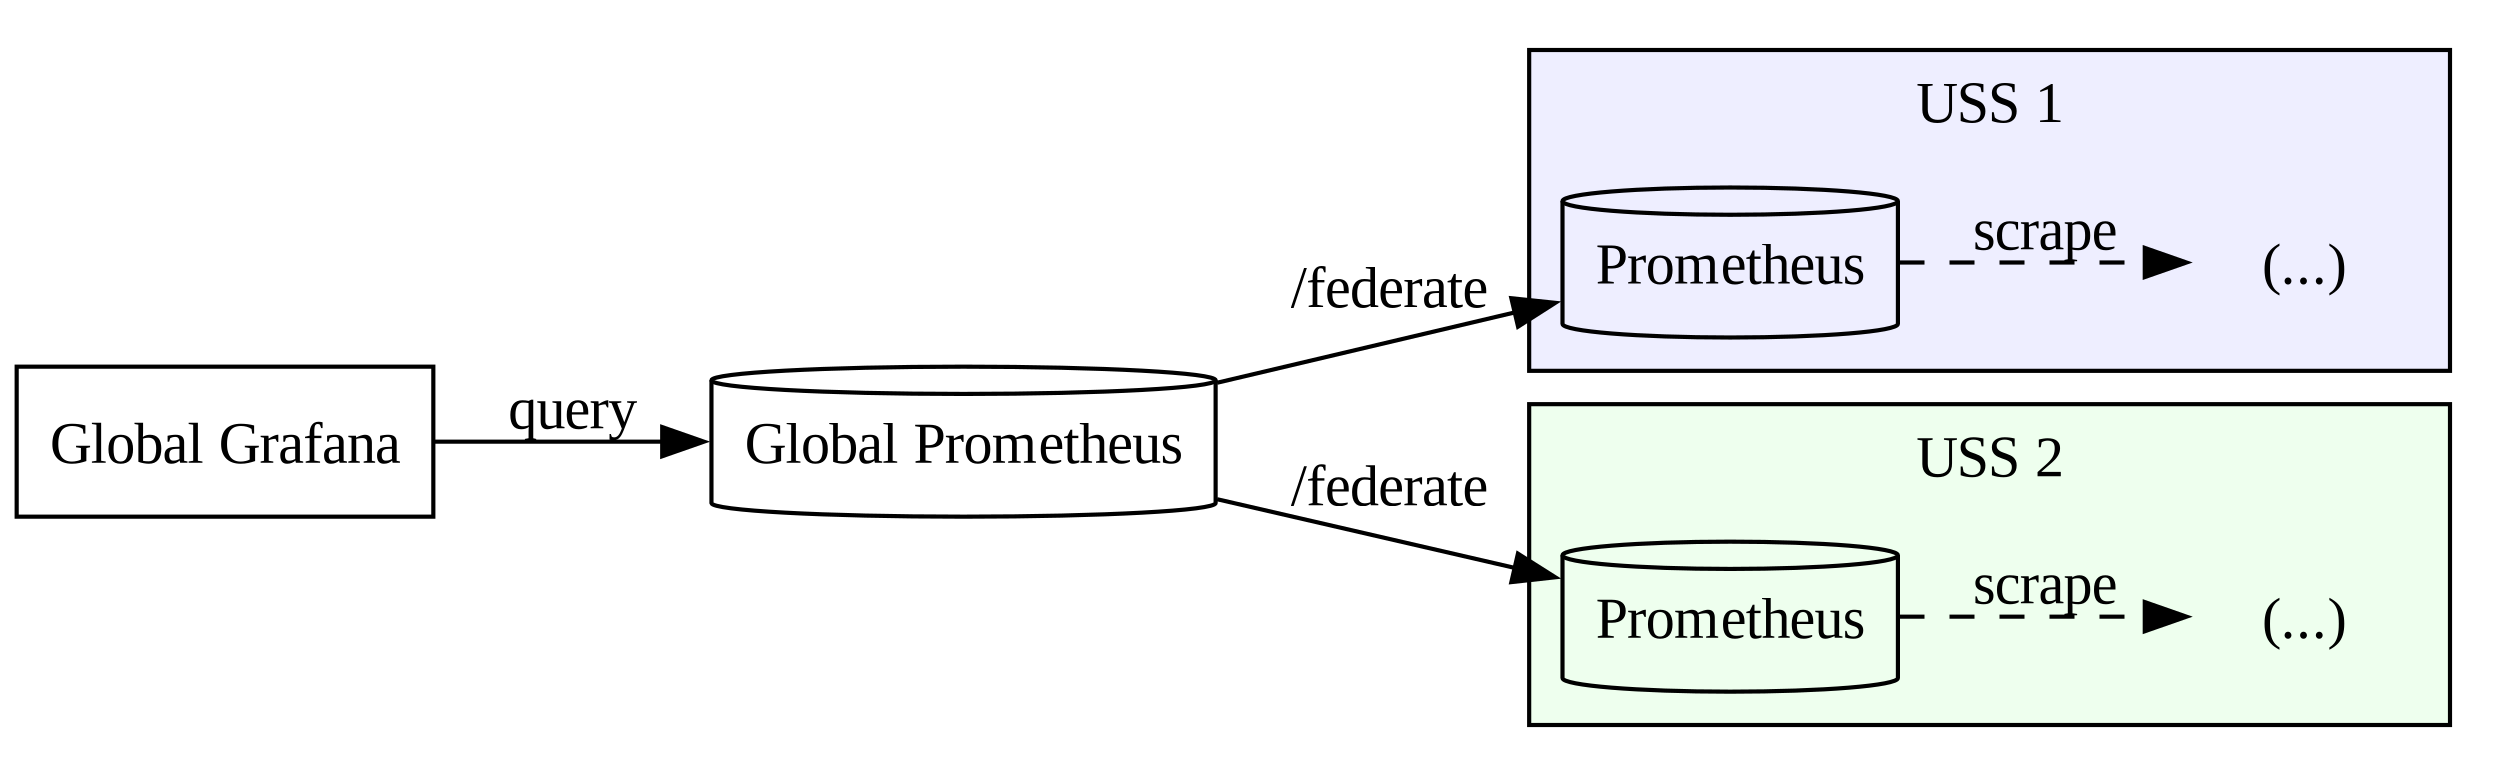
To enable it, you need to do two things:
- Externally expose the Prometheus service of the DSS clusters.
- Deploy a "Global Prometheus" instance to unify metrics.
Externally Exposing Prometheus
- Set the option
prometheus_hostnameto the value of the public hostname that will be used to access your instance. - Apply changes as usual, first by running terraform, and then tanka or helm
- Set
monitoring.externalService.enabledtotrue - [Optional] Set
monitoring.externalService.ipset to a static external IP - [Optional] Set
monitoring.externalService.subnetif you use AWS.
- Set
expose_externaltotrue - [Optional] Supply a static external IP Address to
IP
Deploy "Global Prometheus" instance
- Follow guide to deploy Prometheus https://prometheus.io/docs/introduction/first_steps/
- The scrape rules for this global instance will scrape other prometheus
/federateendpoints and are rather simple, please look at the example configuration as a starting point. -
You will need to enable a client certificate, as this is used to protect the endpoint.
- This uses the same CAs in a cluster. You can use any generated certificate with all Prometheus instances in a cluster.
- Copy the private (
client.grafana.key), public (client.grafana.crt), and CA (ca.crt) keys and make them available to your Prometheus instance, next to the config. Folders are:
deploy/operations/certificates-management/workspace/demo/clients/build/workspace/demo/client_certs_dir/
- Add encryption to your config:
OpenTelemetry
OpenTelemetry is an open-source observability framework for cloud-native software.
You can enable it on the DSS server to get:
- Tracing for all queries
- A Prometheus endpoint with some metrics
Currently, thoses settings are not yet available in Terraform, Helm or Tanka.
Warning
By default, when metrics are enabled, the metrics service listens on all addresses.
Metrics
Use flag --enable_metrics to enable metrics.
Point any Prometheus server to the endpoint (by default on port 8079).
You can use the --metrics_addr flag to change the listening port and address.
A dashboard is automatically deployed by Helm and Tanka. If you use you own grafana instance, it can be found there.
You can use the enable_dss_metrics option in Terraform, dss.conf.enableDssMetrics in Helm, or enableDssMetrics in Tanka to activate it when using these.
This will also automatically enable collection by Prometheus if used.
Tracing
Use flag --enable_tracing to enable tracing.
Traces can be sent to any OpenTelemetry-compliant service. Self-hostable examples include Jaeger, OpenObserve, Grafana Tempo, and SigNoz. Multiple SaaS solutions are also available (including some of the previously mentioned tools).
You need to use the OTEL_EXPORTER_OTLP_ENDPOINT environment variable to configure it. Point it toward your server by following its specific documentation.
Other variables for telemetry (and variables in general) supported by the Go language are available as well if needed.
As an example for local debugging, when using the local Docker Compose file, you can patch it as shown below to add a Jaeger server and point the DSS toward it.